Why does Sitecore CDP show different numbers than my web analytics tool?
If you are looking at your web analytics tool, like Goole Analytics (GA) or Adobe Analytics, and it is not showing the same numbers as Sitecore CDP, don’t panic. There are a few things that could be going on, so let’s troubleshoot.
Firstly, there might be differences with how Sitecore CDP is capturing data and how GA is. Here are some questions which might help you identify differences:
-
Does the GA data cover the same pages that are tagged on Sitecore CDP? Sometimes Campaign Landing pages, for example, are included in GA numbers but may not have Sitecore tags.
-
Does the GA data you are looking at cover the same Points Of Sale (POS) (yoursite.com/ie, yoursite.com/us) as Sitecore CDP?
-
Sitecore CDP closes a web session after X minutes of inactivity. X is different per customer set up. It can be found in the System Settings section of the app. GA usually does this based on time also, at either 30mins of inactivity or at midnight. Are your timeouts consistent across tools?
-
Note that timeouts can be set per POS.
-
Unless you are using GA360, GA tend to use samples of data rather than 100% data. Is this the case with your data?
-
When do you load the GA tag vs. the Sitecore tag? Is it before or after a visitor accepts cookies? From the consent perspective, do you treat the two systems the same?
-
Is GA stripping out suspected Bot activity in your account? Sitecore CDP does not do that by default.
Unless you are comparing exactly the same approaches to data capture, the systems will show different data. In theory, you should expect them to trend the same way if the same pages have been tagged, they are loaded at the same time and there are no filters applied to each.
In our experience, generally, Sitecore CDP trends the same as Adobe and Google Analytics.
If you are still experiencing differences, here are some next steps.
Export daily traffic volumes from your GA and Sitecore CDP account. In Sitecore CDP, this is simple;
- Go to the Summary Report in the Dashboard section of the app.
- Click the Inbound Channel tile.
- Set the filters to the required Timeframe, Channel and Resolution.
- Click Run and wait for results.
- Click the gear icon and export to CSV.
You can then use Excel to align the data and graph it out. It should look something like this:
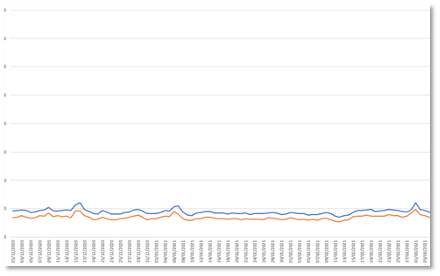
If you are seeing variances, it is important to dig deeper with your technical resources to understand why these are occurring. If you still can't find the cause of the variances, log a support ticket on the Sitecore Support Portal.

Ruadhán Barry
Director of Analytics
Updated 3 months ago